Very fast data acquisition with large spectral range. The M-2000V model can measure from 370nm to 1700nm. Measures enough wavelengths to obtain thickness from thick photoresists (up to 10 microns thick). The ideal instrument for fast thickness uniformity mapping and in-situ applications, such as real-time dissolution rate monitoring. This ellipsometer is capable of scanning areas ranging from 1cm2 to 6 in2 and patterns from single point scans to a 32+ point profile.
Spectroscopic Ellisometer
More Info
Ellipsometry measures the change of polarization upon reflection or transmission. Typically, ellipsometry is done only in the reflection setup. The exact nature of the polarization change is determined by the sample's properties (thickness, complex refractive index or dielectric functiontensor). Although optical techniques are inherently diffraction limited, ellipsometry exploits phase information and the polarization state of light, and can achieve angstrom resolution. In its simplest form, the technique is applicable to thin films with thickness less than a nanometer to several micrometers. The sample must be composed of a small number of discrete, well-defined layers that are optically homogeneous, isotropic, and non-absorbing. Violation of these assumptions will invalidate the standard ellipsometric modeling procedure, and more advanced variants of the technique must be applied (see below).


Data Acquisition
(Standard) Ellipsometry measures two of the four Stokes parameters, which are conventionally denoted by Ψ and △. The polarization state of the light incident upon the sample may be decomposed into an s and a p component (the s component is oscillating perpendicular to the plane of incidence and parallel to the sample surface, and the p component is oscillating parallel to the plane of incidence). The amplitudes of the sand p components, after reflection and normalized to their initial value, are denoted by rs and rp, respectively. Ellipsometry measures the ratio of rs and rp, which is described by the fundamental equation of ellipsometry:
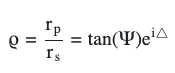
Thus, tanΨ is the amplitude ratio upon reflection, and △ is the phase shift (difference). Since ellipsometry is measuring the ratio (or difference) of two values (rather than the absolute value of either), it is very robust, accurate, and reproducible. For instance, it is relatively insensitive to scatter and fluctuations, and requires no standard sample or reference beam.
Data Analysis
Ellipsometry is an indirect method, i.e. in general the measured Ψ and △ cannot be converted directly into the optical constants of the sample. Normally, a model analysis must be performed. Direct inversion of Ψ and △ is only possible in very simple cases of isotropic, homogeneous and infinitely thick films. In all other cases a layer model must be established, which considers the optical constants (refractive index or dielectric function tensor)and thickness parameters of all individual layers of the sample including the correct layer sequence. Using an iterative procedure (least-squares minimization) unknown optical constants and/or thickness parameters are varied, and Ψ and △ values are calculated using the Fresnel equations. The calculated Ψ and △ values, which match the experimental data best, provide the optical constants and thickness parameters of the sample.
Single-wavelength vs. Spectroscopic Ellipsometry
Single-wavelength ellipsometry employs a monochromatic light source. This is usually a laser in the visible spectral region, for instance, a HeNe laser with a wavelength of 632.8 nm. Therefore, single-wavelength ellipsometry is also called laser ellipsometry. The advantage of laser ellipsometry is that laser beams can be focused on a small spot size. Furthermore, lasers have a higher power than broad band light sources. Therefore, laser ellipsometry can be used for imaging (see below). However, the experimental output is restricted to one set of Ψ and △ values per measurement. Spectroscopic ellipsometry (SE) employs broad band light sources, which cover a certain spectral range in the infrared, visible or ultraviolet spectral region. By that the complex refractive index or the dielectric function tensor in the corresponding spectral region can be obtained, which gives access to a large number of fundamental physical properties. Infrared spectroscopic ellipsometry (IRSE) can probe lattice vibrational (phonon) and free charge carrier (plasmon) properties. Spectroscopic ellipsometry in the near infrared, visible up to ultraviolet spectral region studies the refractive index in the transparency or below-band-gap region and electronic properties, for instance, band-to-band transitions or excitons.
"Ellipsometry." Wikipedia, The Free Encyclopedia. 7 Feb 2008, 07:07 UTC. Wikimedia Foundation, Inc. 14 Feb 2008 <http://en.wikipedia.org/w/index.php?title=Ellipsometry&oldid=189685483>.